I have written software that manipulates confocal images to meet specific imaging needs of Center for Cell Dynamics researchers. In due time (ie when one of us finds time to put more user-friendly interfaces on this software) we will make these tools available as freeware.
The following links open 3-D objects as quicktime movies in new windows. These movies are image-processed confocal stacks. All movies on our web site belong to the Center for Cell Dynamics. They were made in the course of our research from our primary data. Please do not use these images without consulting us unless otherwise noted. In all cases the borrowed material must be credited to the Center for Cell Dynamics and where available also credited to the individual(s) associated with the movie.
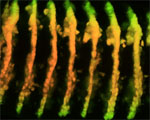
Software to convert a time series of laser scanning confocal images, each time step of which is a Z series, into a 4-D movie. The sample below shows the way the invaginated neurectoderm retains its segmented organization during brain formation, while axons connect the engrailed-stained brain segments back to the ectodermal segments of origin.
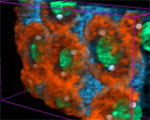
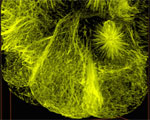
Software to make 3-D reconstructions from multi-probe merged stacks of raw data, each with hundreds of finely-spaced laser scanning confocal micrographs. Distributed computer software I wrote "segments" micrographs, picking out structures of interest and rendering as transparent low level fluorescence and non-specific background staining to facilitate seeing deep into the volume reconstructed. I devised a natural selection scheme to find the "best" segmentation algorithm by selecting from a chain of image-processing filters and then fine-tuning their parameter settings to show the structures of interest.
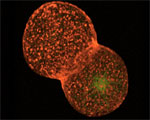
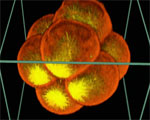
In the first three sample reconstructions shown below, I render invisible a general low level of F-actin and of myosin II staining throughout all the cytoplasm and the viewer must imagine this permeating the much brighter regions of F-actin and myosin II probe shown. With one exception, every part of each the 3-D reconstruction is actual data the LSCM recorded (not a mathematized representation of the data). The exception is that the centrosomes are mathematical spheres placed where gamma tubulin staining shows the centrosomes are. The following samples share the same color code.
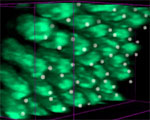
Software that can be distributed across a computer network to deconvolve confocal stacks and hence correct spherical aberration and replace out-of-focus fluorescence with in-focus structural information.
These samples of deconvolved data are presented as stereo pair movies. The first sample shows F-actin and microtubules of an interphase 10 Drosophila embryo, just as the migrating nuclei reach the cortex and F-actin begins to accumulate near centrosomes. The second movie shows myosin II and microtubules of a cycle 10 Drosophila embryo at prophase, and illustrates the orientation of microtubules with respect to the myosin-depleted holes in the cortex that form above nuclei. The following first two samples share the same color code. The last movie contrasts the original data, the data following several iterations of deconvolution, and the final data after the deconvolution converges.
Deconvolved F-actin and microtubule confocal stack of syncytial fly embryo (3-D reconstruction displayed as a stereo pair movie)
[1040 x 580 pixels, 68.2 MB]
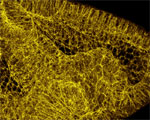
Deconvolved myosin II and microtubule confocal stack of syncytial fly embryo (3-D reconstruction displayed as a stereo pair movie)
[1040 x 580 pixels, 68.2 MB]