
(Diana White)
The forces that drive neural plate invagination are intrinsic to the anterior half of the embryo, but the movements that generate neural tube closure initiate in the posterior of the embryo.
In order to understand the cellular basis of neural plate invagination and closure, we focused first on providing a descriptive framework of the dynamical behaviors of ascidian neural plate cells. And we specifically investigated the behavior, during the early stages of neurulation , of the A-lineage cells in Ciona intestinalis.. A-line cells are those that, at later development stages, will make up the floor plate and most of the lateral walls of the neural tube.
To understand the dynamical behavior of the A-line cells, we made time-lapse confocal microscopy movies of embryos with fluorescently-labeled cell membranes (movie 1). To make sense of our complex, 4-dimensional dataset, we then made 3-D reconstructions of the A-line cells at seven (equally spaced) time points during the early neurula stage, using of the software Amira and 3D Virtual Embryo (Tassy et al, 2006).
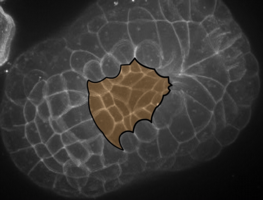
Movie 1: fluorescently-labeled cells reveal A-line behavior
These reconstructions (figure 1) revealed several interesting cell and tissue-level behaviors. For example, we observed cell intercalation in floor plate cells (figure 2), as well as in the cells that will form the walls of the nerve tube (figure 3). However, intercalation is different in these two cell groups. We found that the floor plate cells converge along the medio-lateral axis, extending (stretching) along the anterior/posterior axis. In contrast, the lateral cells intercalate and stretch in a direction perpendicular to floor plate extension.
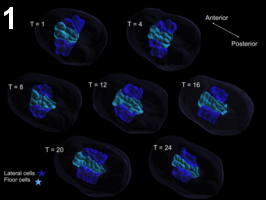
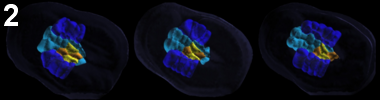
Figure 1: 3-dimensional reconstruction of floor plate (light blue) and lateral cells (dark blue) during neurulation in Ciona. 3d reconstruction generated from the confocal stack of Movie 2. Vegetal view, anterior is upper left. Reconstructed time-frames are 20 min. apart.
Figure 2: Cell-cell intercalation of floor cells. Yellow and orange cells are intercalating between T12 and T20, simultaneous with neural plate elongation.
Figure 3: Cell-cell intercalation of lateral cells. Dark blue and yellow cells are intercalating between T8 and T12, simultaneous with neural plate elongation.
To gain further insight into the mechanical roles of these cells, we perturbed the normal dynamics of the neural plate at the mid-gastrula stage, when the A-line consists of just eight cells. At this stage, the cell fate of the floor and lateral cells are distinct and completely determined. Since our studies showed that invagination of the neural plate progresses from posterior to anterior, we used laser ablation of the four middle A-line cells (figure 4) to determine whether or not invagination is dependent on specific cell-cell interactions (note that the four middle cells of the A-line are those that will make up the entirety of the floor plate). Our results showed that invagination is delayed (figure 5 Green:anterior neural, Cyan: medio-neural, Blue: posterior neural (A-line), Red: notochord), but otherwise proceeds in a manner similar to that of wild-type embryos, and still progresses from posterior to anterior (figure 6, movie 2, figure 7). We found that anterior neural plate cells are able to reorganize and take the place of the missing posterior cells (figure 5-6, cyan label replaces blue label in ablated embryos).
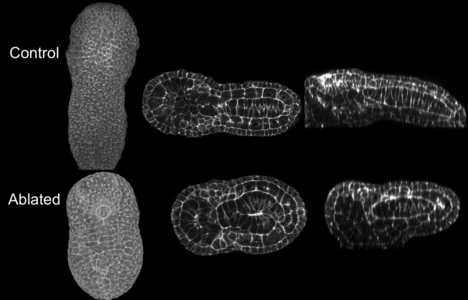
Figure 7: Effect of laser ablation of A-line neural cells, tailbud stage. Embryos ablated at the 64-cell are fixed at the tailbud stage. Embryo elongation is slightly affected. Red, notochord; dark blue, A-line neural cells; light blue and green, posterior and anterior a-line neural cells, respectively. Left, 3d projection, vegetal view; middle: frontal view; right, sagittal view.
Interestingly, we also found that in ablated embryos, convergent extension of the notochord occurs by a different path than normally. Indeed, in ablated embryos the remaining A-line cells form a U-shaped tube at the same time that notochord cells are extending to form a tail in control embryos (figure 7). It is from this U-shaped formation that cells further intercalate, and notochord extension proceeds, giving rise to a similar morphological structure but by a different morphogenetic route.